NSW

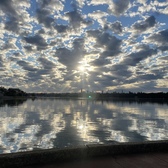
Uphill climb on the local morning WFH loop


| Name | Staff Count | Riders | Participation | Trips |
|---|---|---|---|---|
| Arup Group - Sydney | 800 | 150 | 18.8% | 22413 |
| Arup Group - Melbourne | 500 | 96 | 19.2% | 12512 |
| Name | Staff Count | Riders | Participation | Trips |
|---|---|---|---|---|
| Arup Group - Brisbane | 437 | 119 | 27.2% | 13947 |
| Name | Staff Count | Riders | Participation | Trips |
|---|---|---|---|---|
| Arup Group - Perth | 100 | 6 | 6.0% | 659 |
| Arup Group - Adelaide | 100 | 15 | 15.0% | 1079 |
| Name | Staff Count | Riders | Participation | Trips |
|---|---|---|---|---|
| Arup - Sunshine Coast | 25 | 2 | 8.0% | 28 |
| Arup Group - Canberra | 20 | 5 | 25.0% | 337 |
| Name | Department | Trips | kilometers |
|---|---|---|---|
| Mark Fyson | Buildings NSW | 1965 | 39,280 |
| Laure Ruy | Consulting NSW | 1556 | 9,683 |
| Kacy Brennan | Consulting NSW | 1395 | 21,447 |
| Cathie Norton | Group 2 - Arup Brisbane | 1321 | 21,045 |
| Clement Bong | Consulting NSW | 1098 | 9,629 |
| Michael Alder | Digital | 1066 | 30,063 |
| Krusty The C Lown | Ground Engineering | 985 | 11,563 |
| Antony Schofield | Group 1 - Brisbane | 976 | 14,058 |
| Peter Whitson | NSW Transport and Resources | 905 | 25,222 |
| Alex Edwards | Buildings NSW | 856 | 10,325 |